|
|||||||||||||||||||||||||||||||||||
|
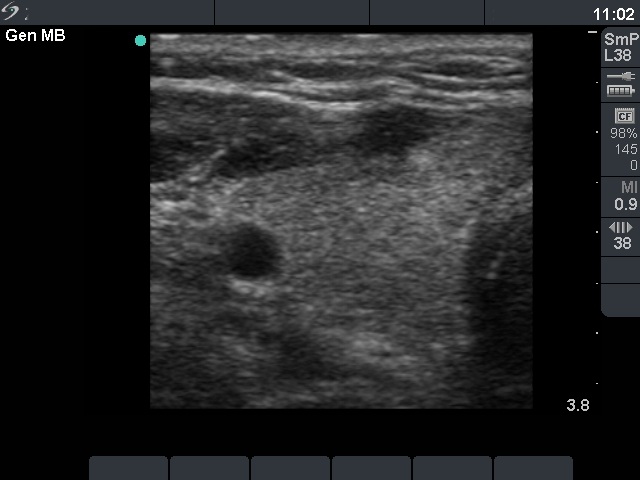
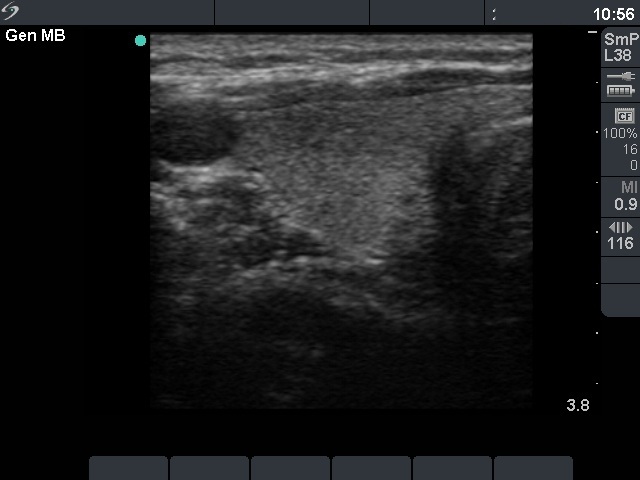
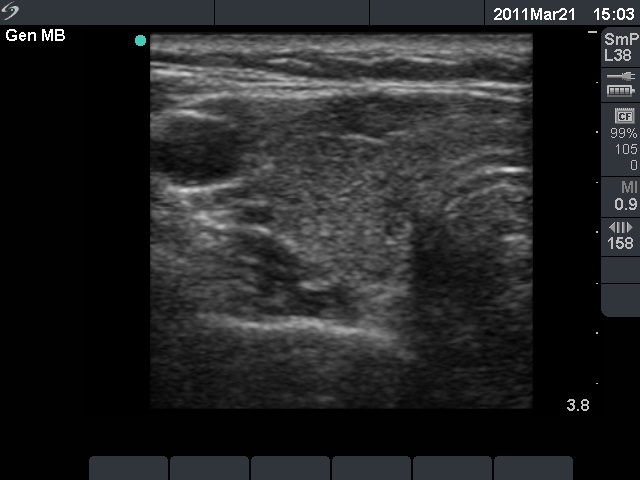
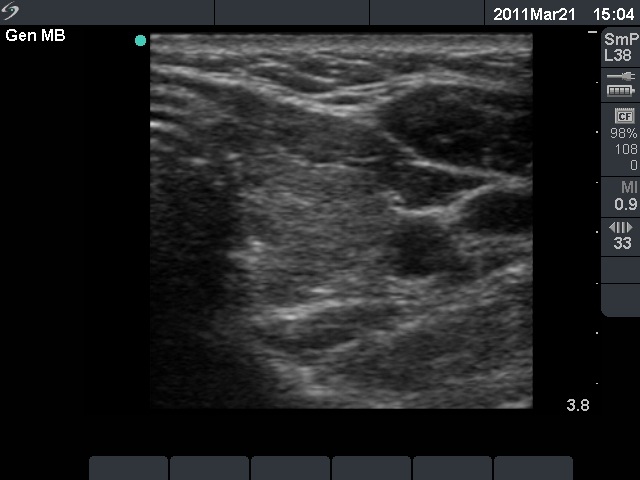
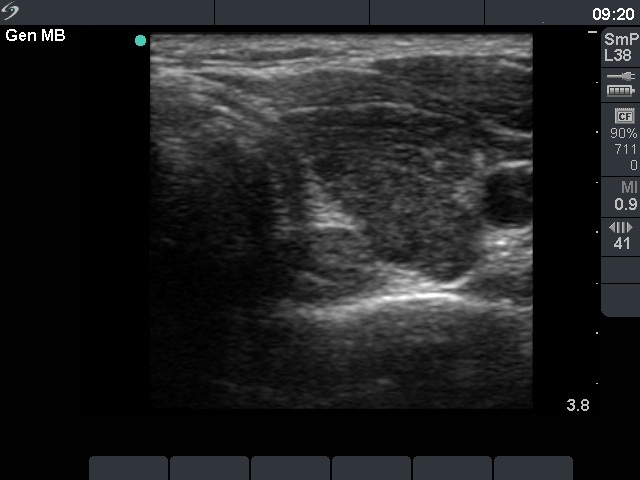
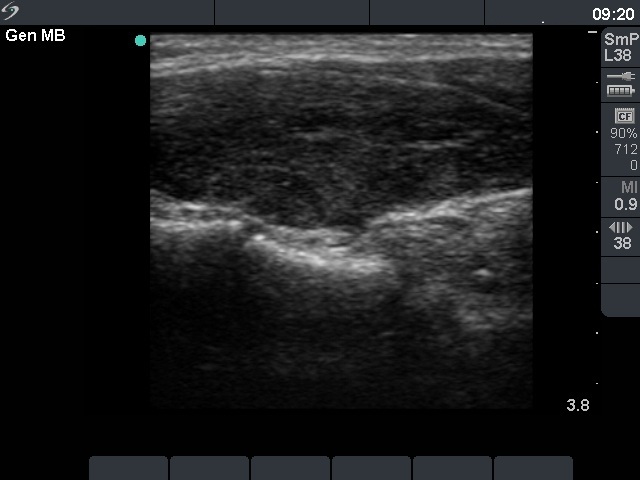
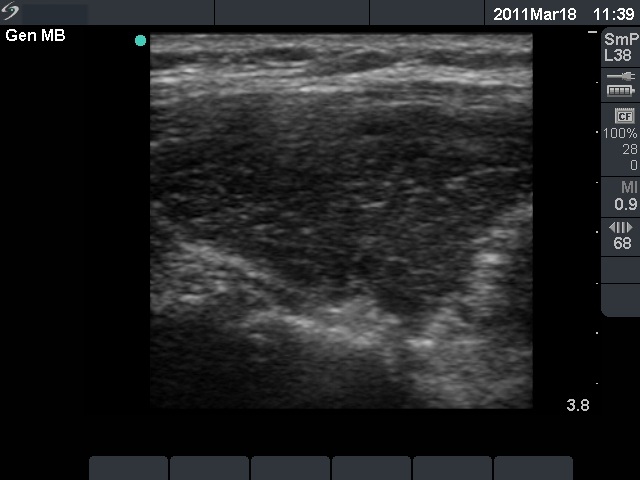
Ultrasonographic appearence of
lymphocytic thyroiditis. Table 3 - diffuse form
|
|||||||||||||||||||||||||||||||||||
|
|||||||||||||||||||||||||||||||||||
|
The hypoechogenicity is increasing from top to bottom pictures. The first 4 rows demonstrate echonormal, minimally hypoechogenic thyroids. Thyroids presented in the next two rows are moderately hypoechogenic, while those in the last two rows are severely hypoechogenic. |
|||||||||||||||||||||||||||||||||||