Echogenic figures
|
|||||||||||||||||||||||||||||||||||||||||||||||||||||||||||||||||||||||||
Intranodular hyperechogenic figures - Table 3. Cystic back wall figures |
|||||||||||||||||||||||||||||||||||||||||||||||||||||||||||||||||||||||||
|
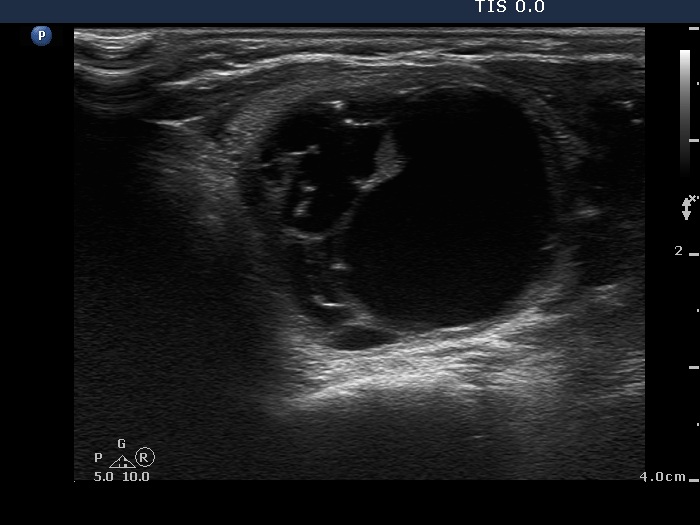
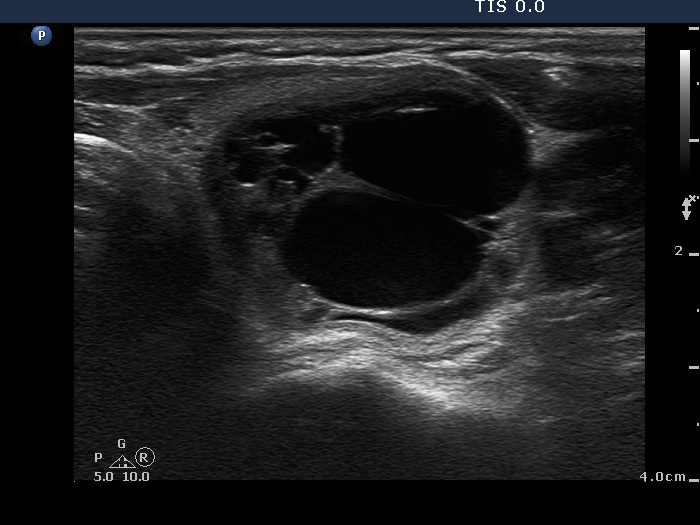
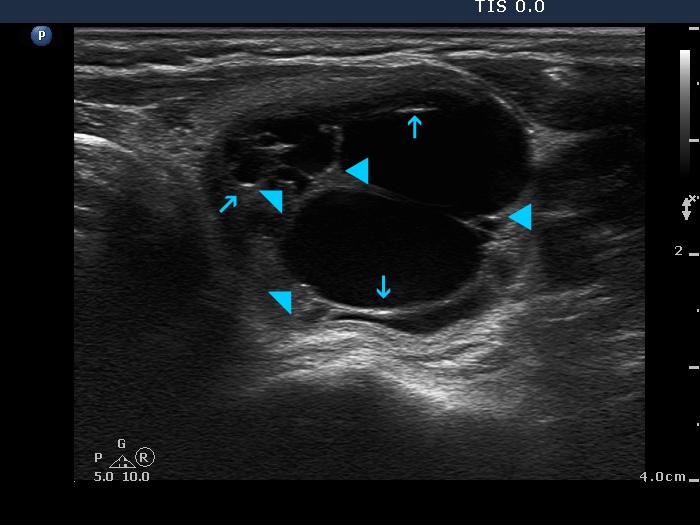
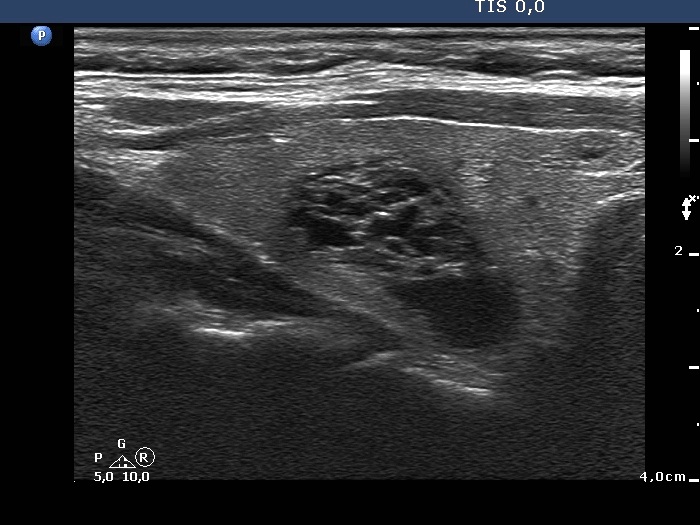
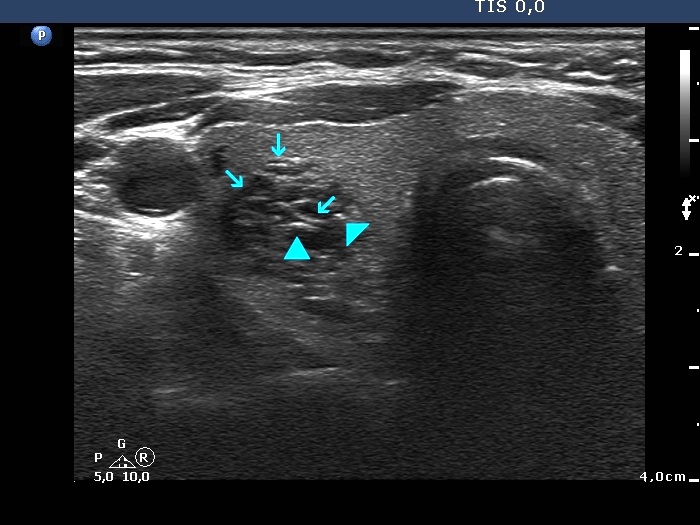
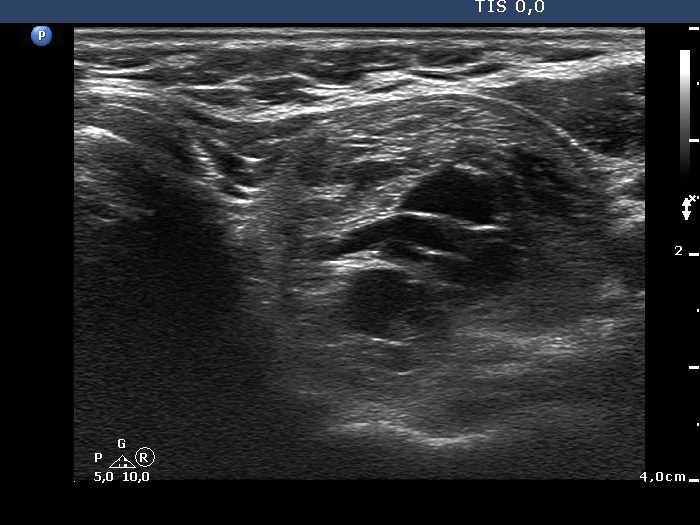
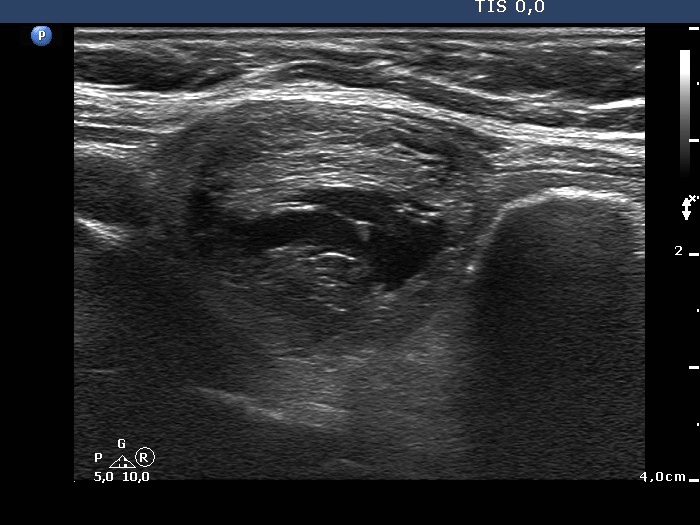
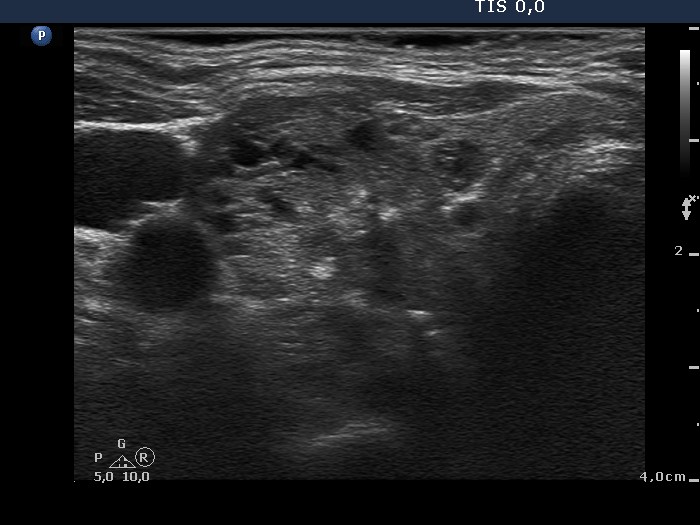
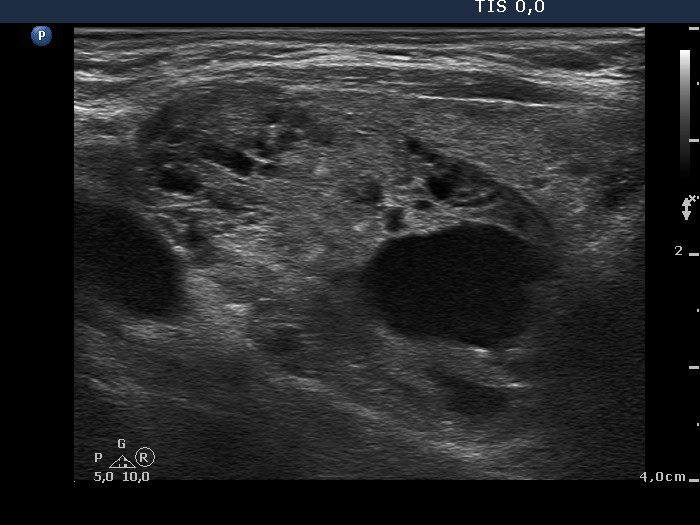
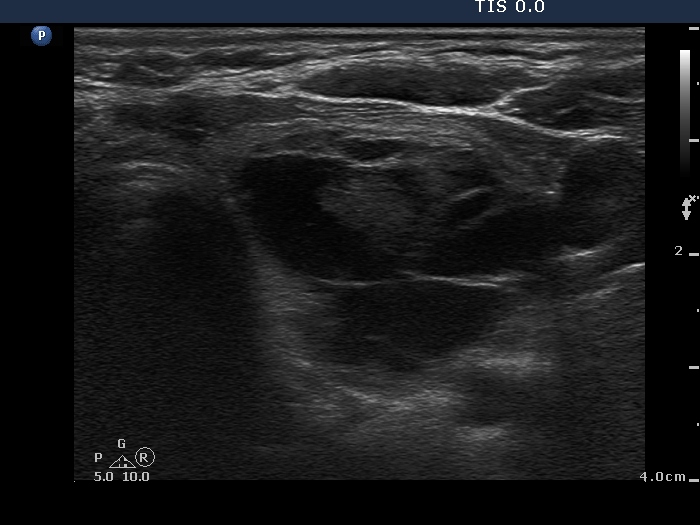
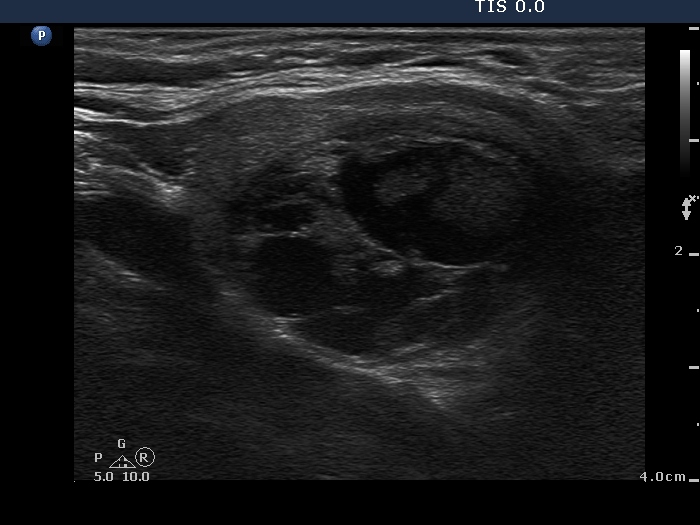
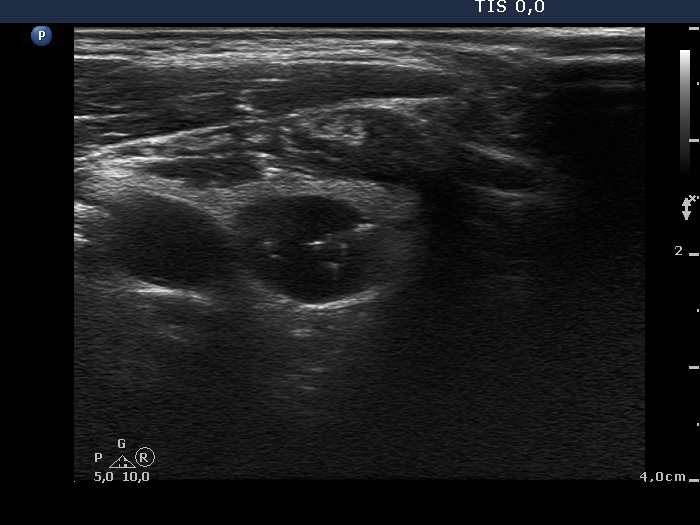
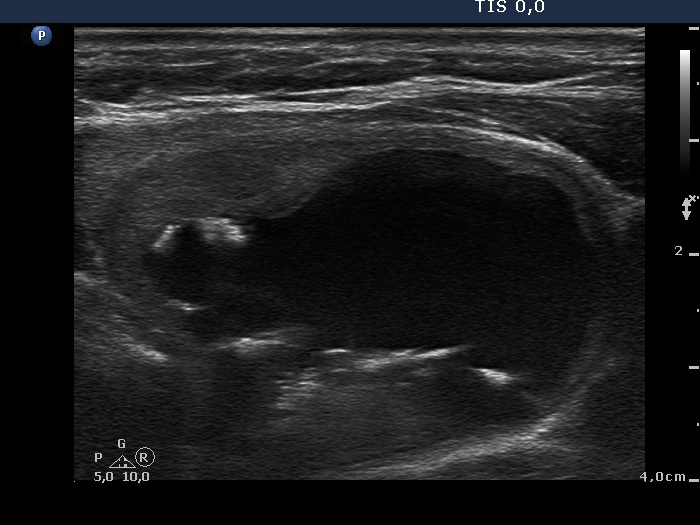
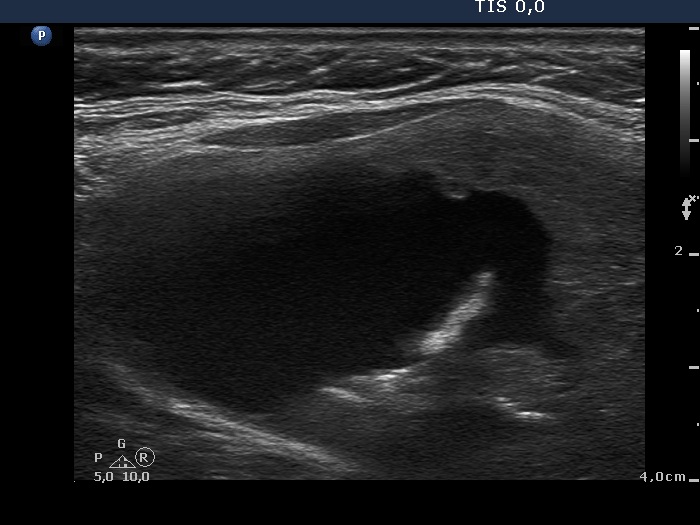
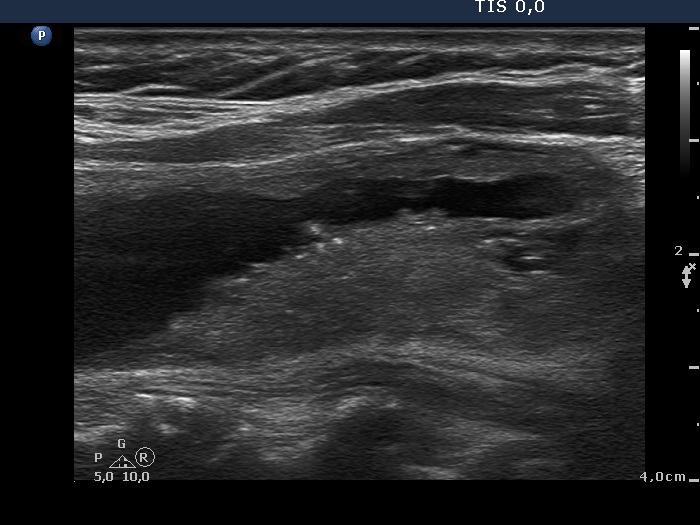
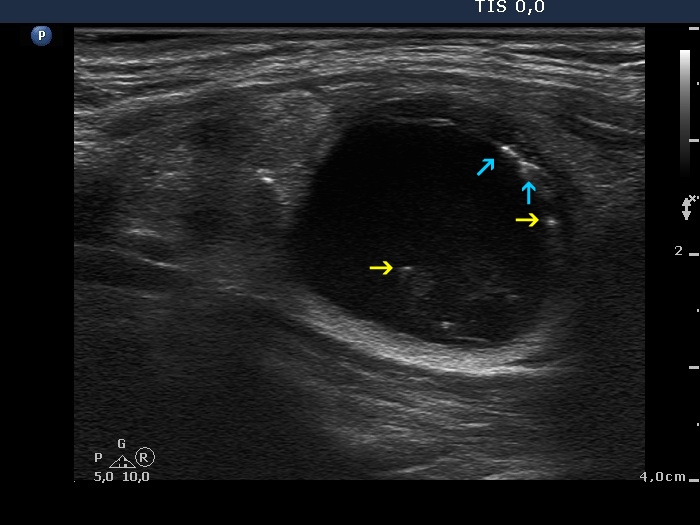
This is the only figure which is virtual and is an optical artifact caused by the enhancement of the ultrasound dorsal to the cystic fluid. It appears in the back wall of cystic areas or even just dorsal to the wall in the parenchyma. If it appears as a linear figure, we have no problem. However, hyperechogenic granules might be misinterpreted as punctate echogenic foci (microcalcifications). |
|||||||||||||||||||||||||||||||||||||||||||||||||||||||||||||||||||||||||
|
|||||||||||||||||||||||||||||||||||||||||||||||||||||||||||||||||||||||||